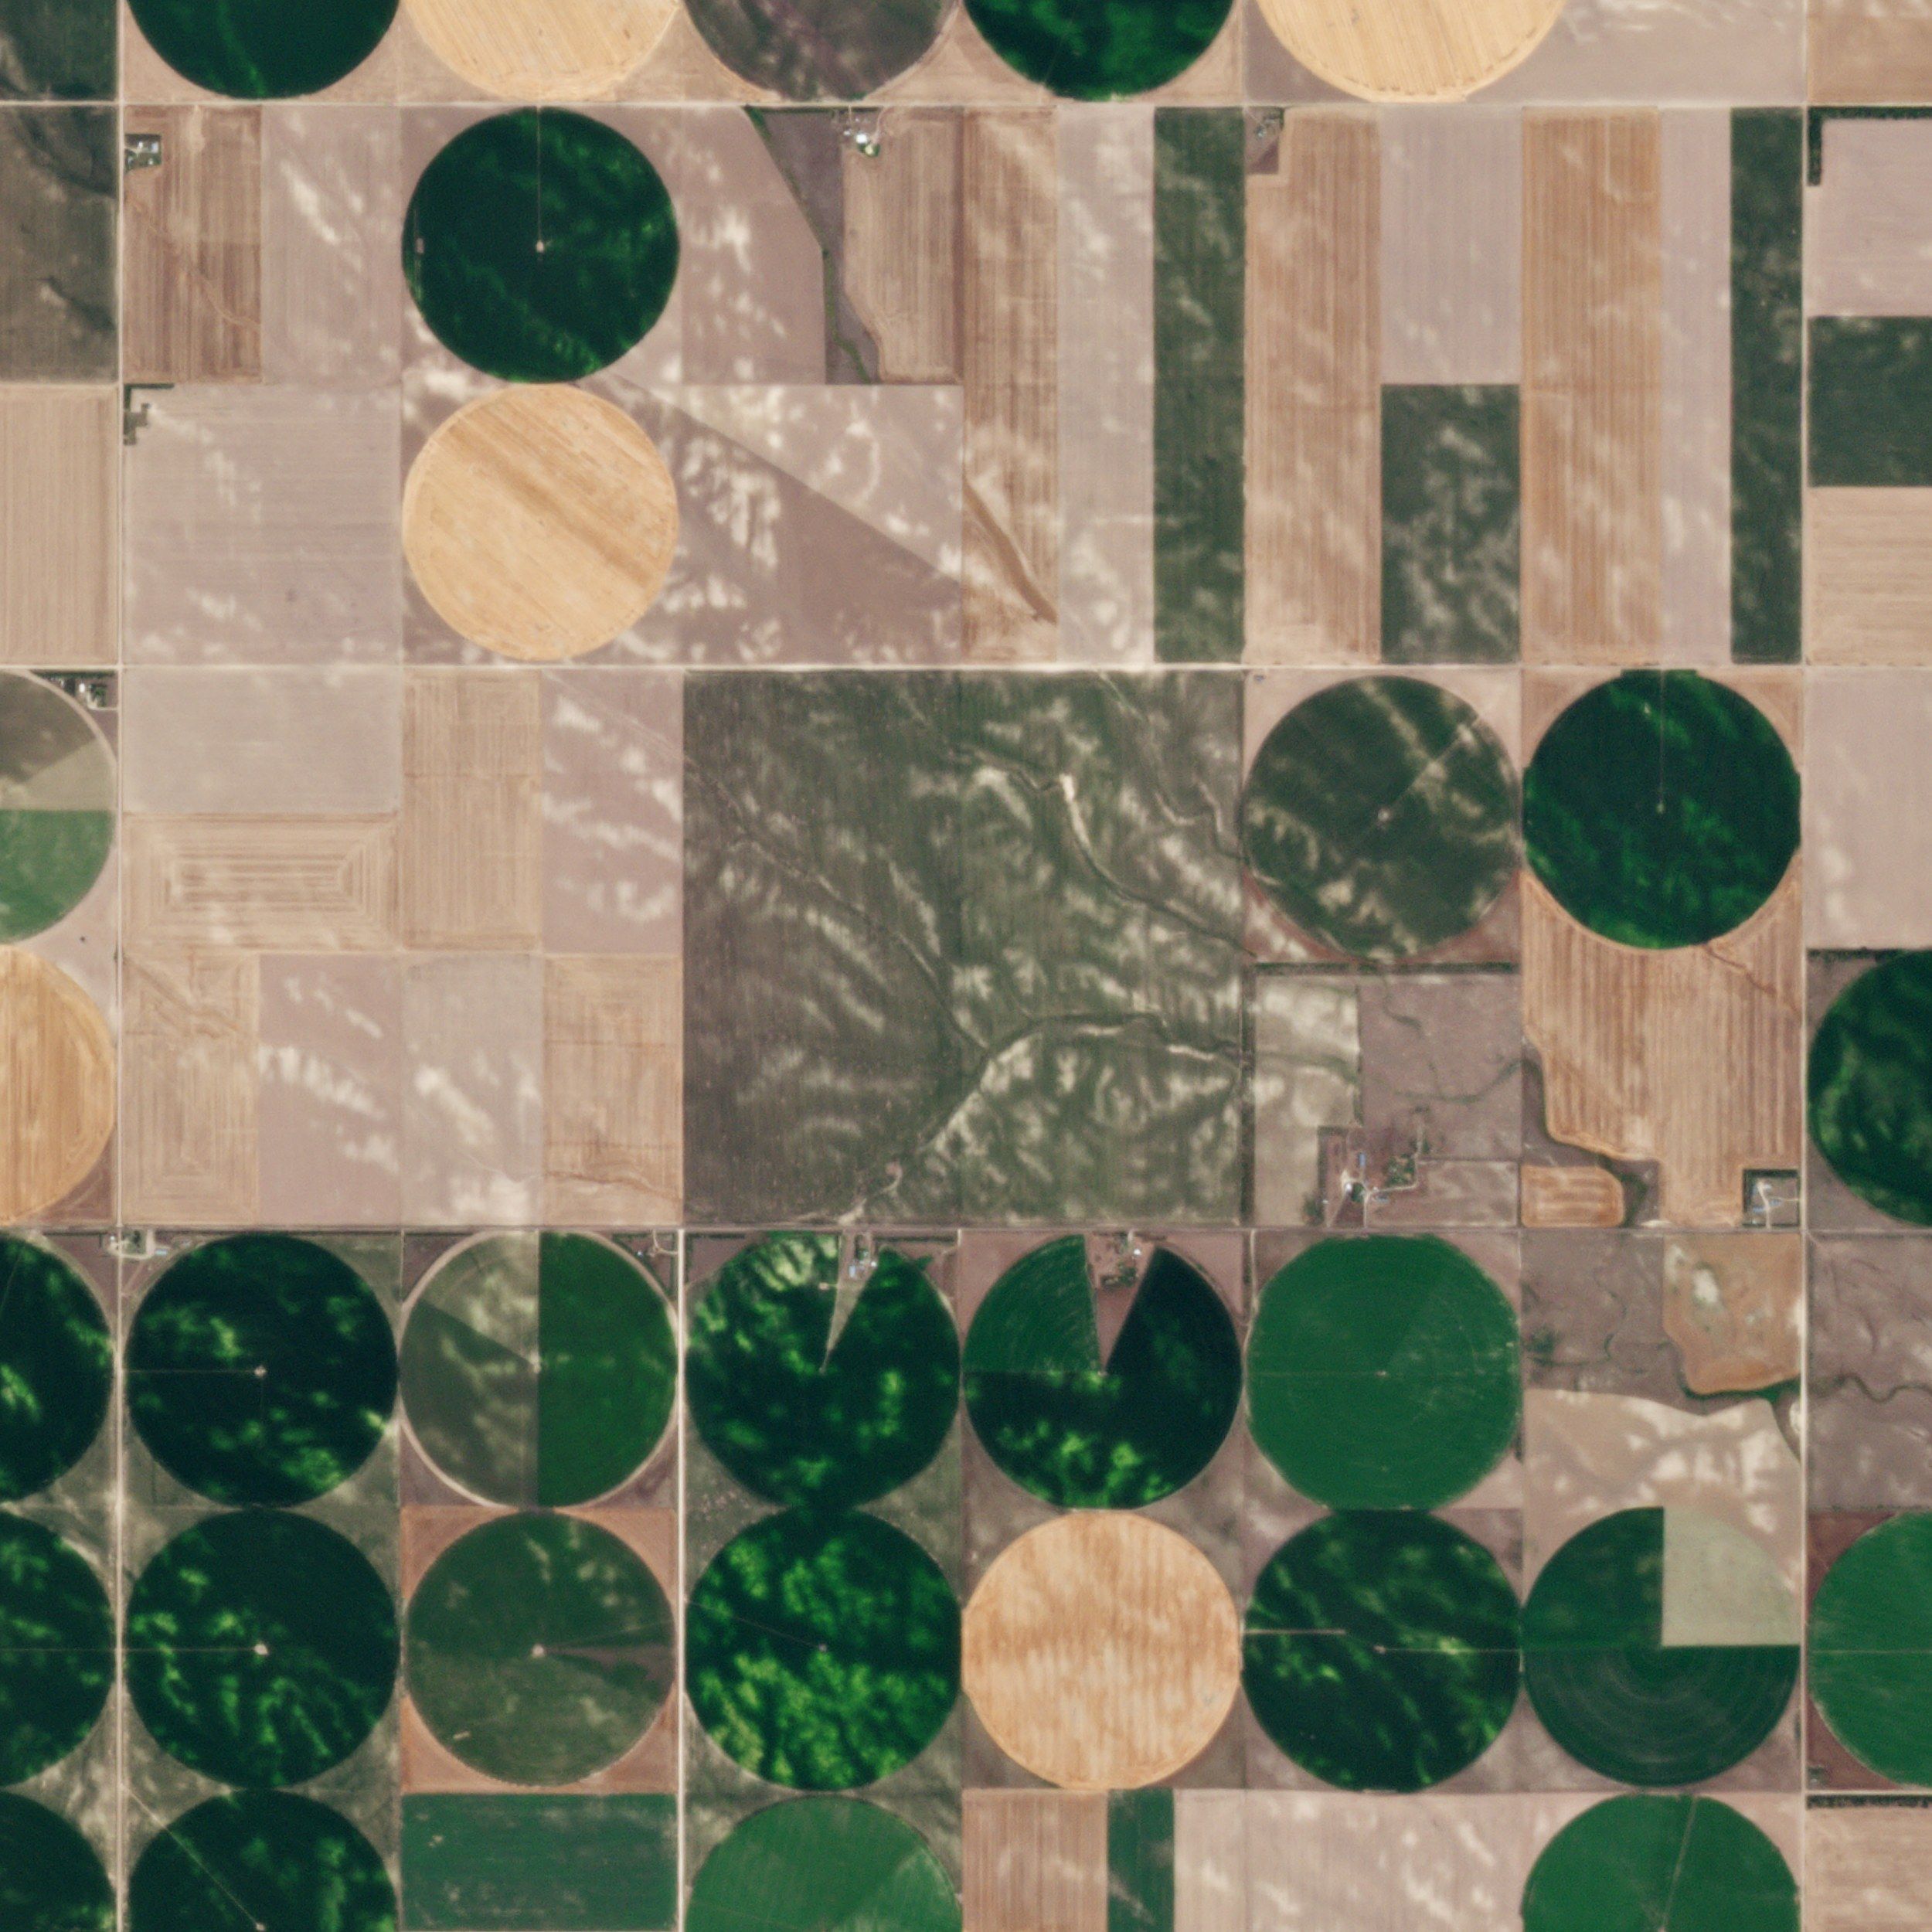
Agriculture monitoring
Vegetation indices, crop maps and parcel alerts through the season, from optical, hyperspectral, thermal and SAR imagery.
- 3 mOptical, daily
- 5 mHyperspectral
- 30 mThermal
Indices
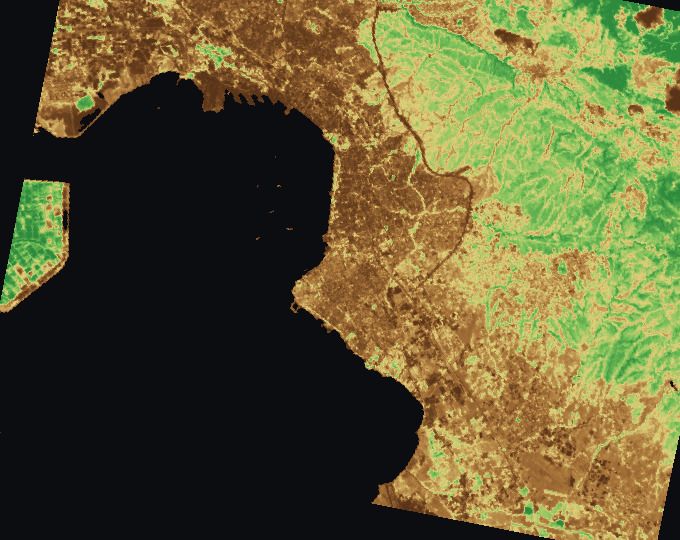
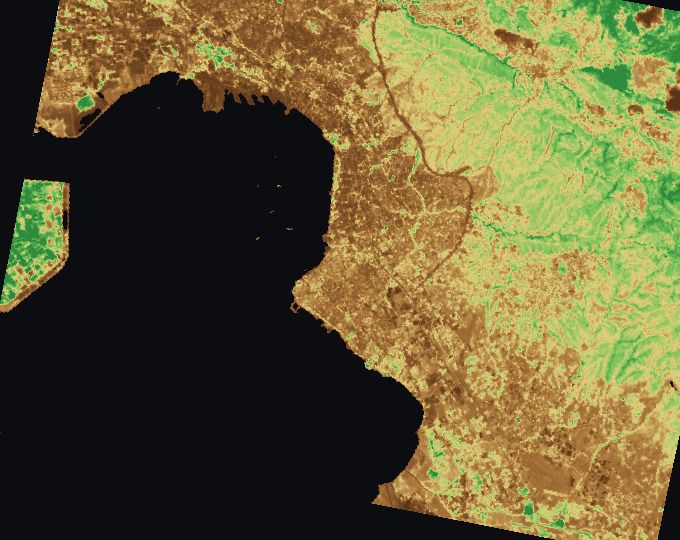
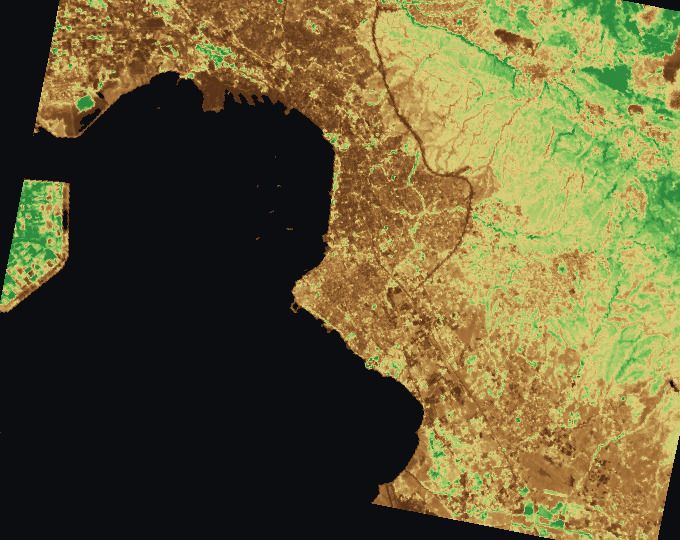
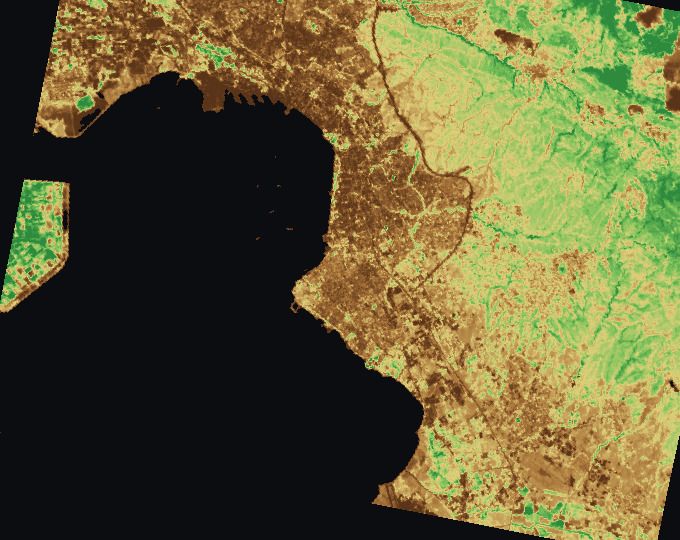
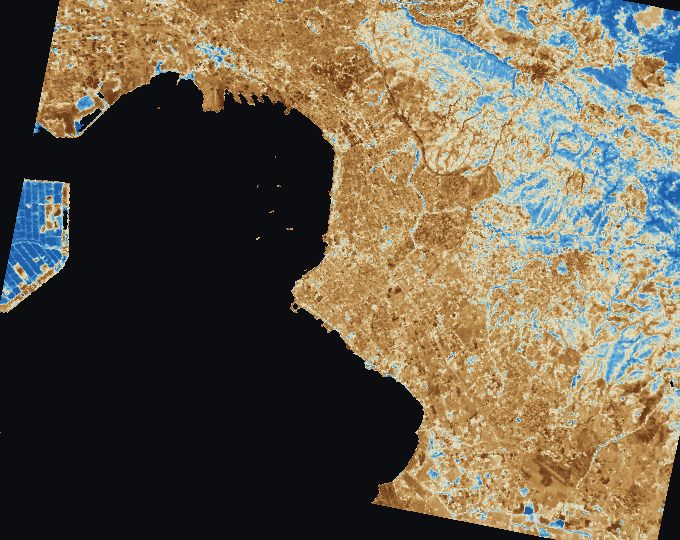
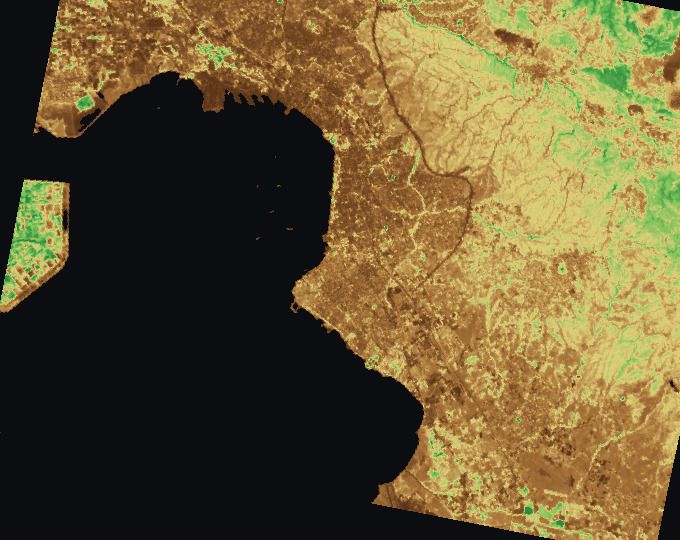
On this sceneMedian, land
From other sensors
- LSTThermalWater stress and irrigation need
- Soil moistureSARSurface moisture, through cloud
Example
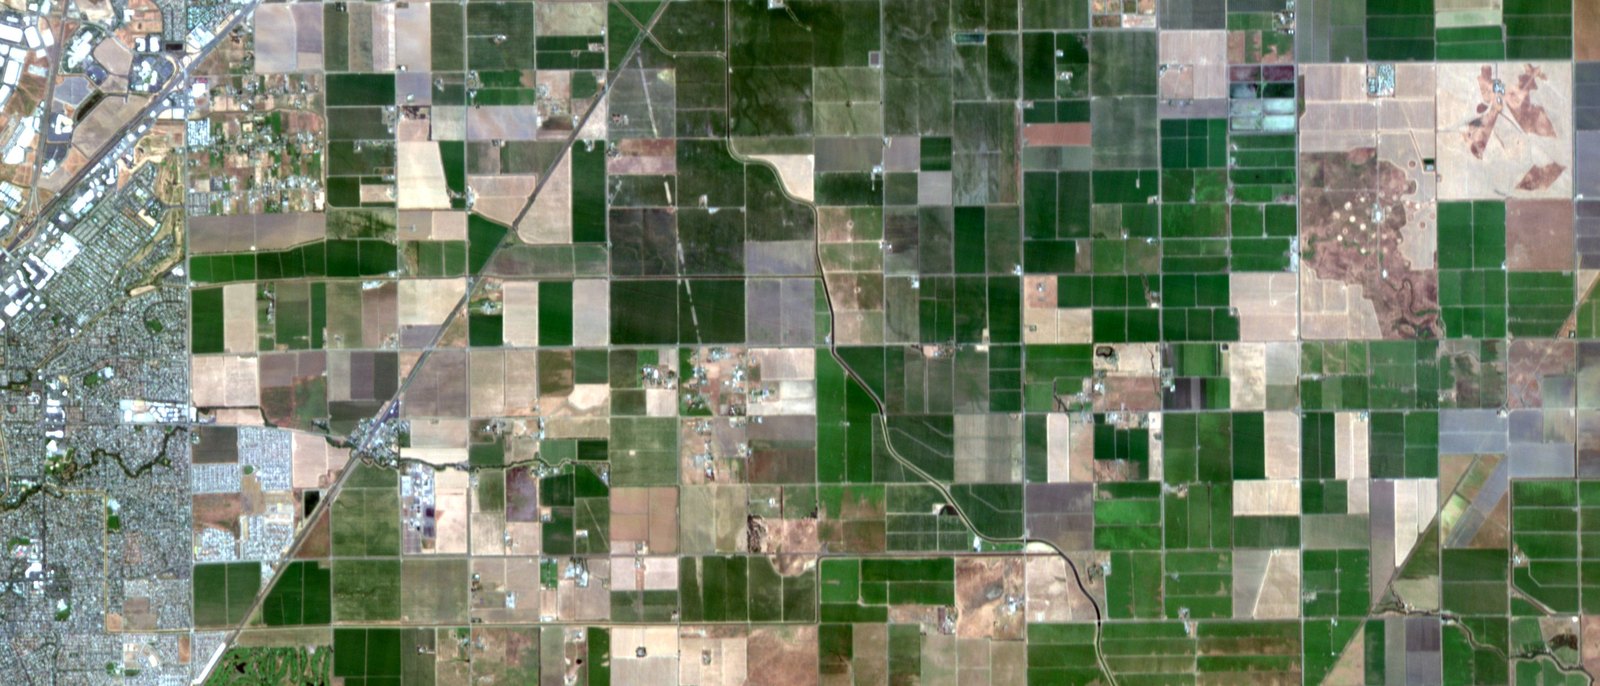
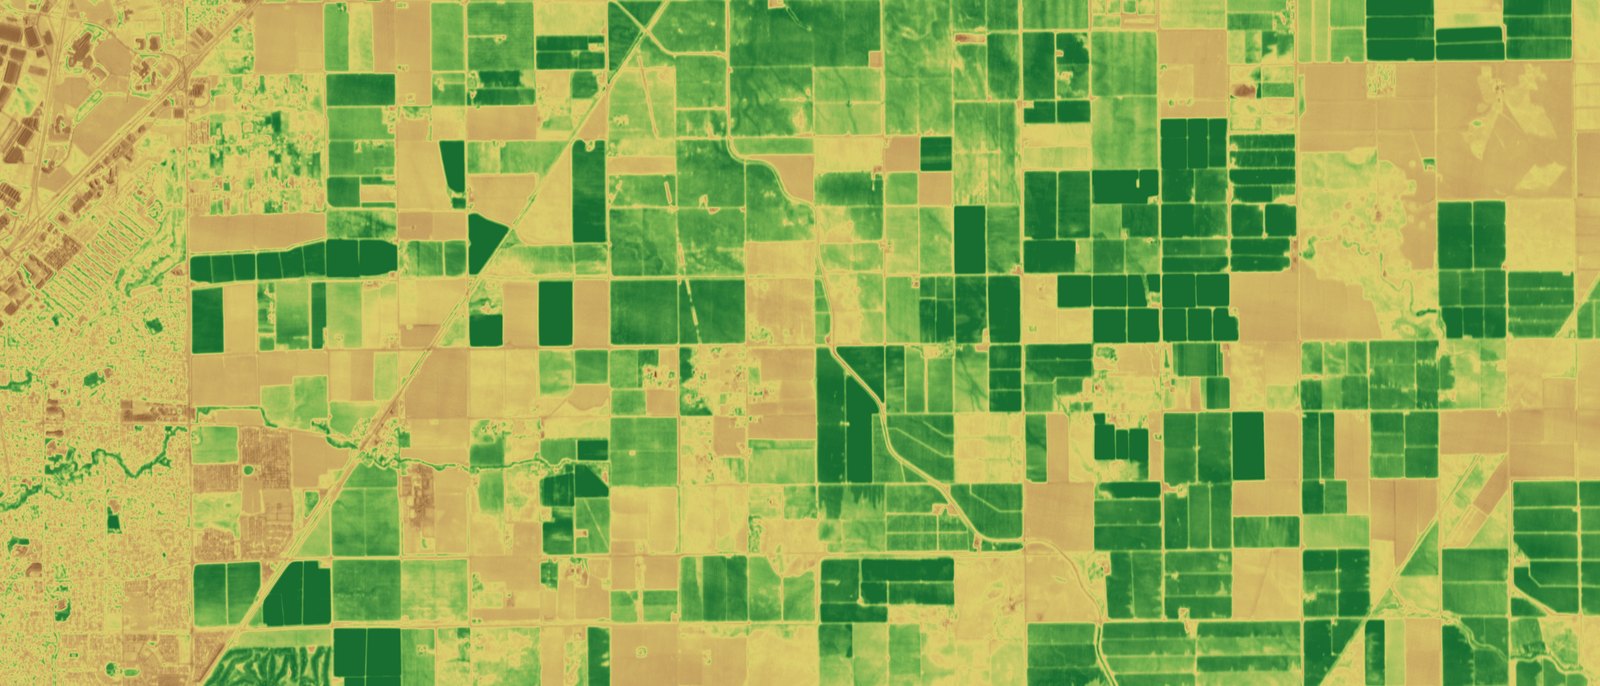
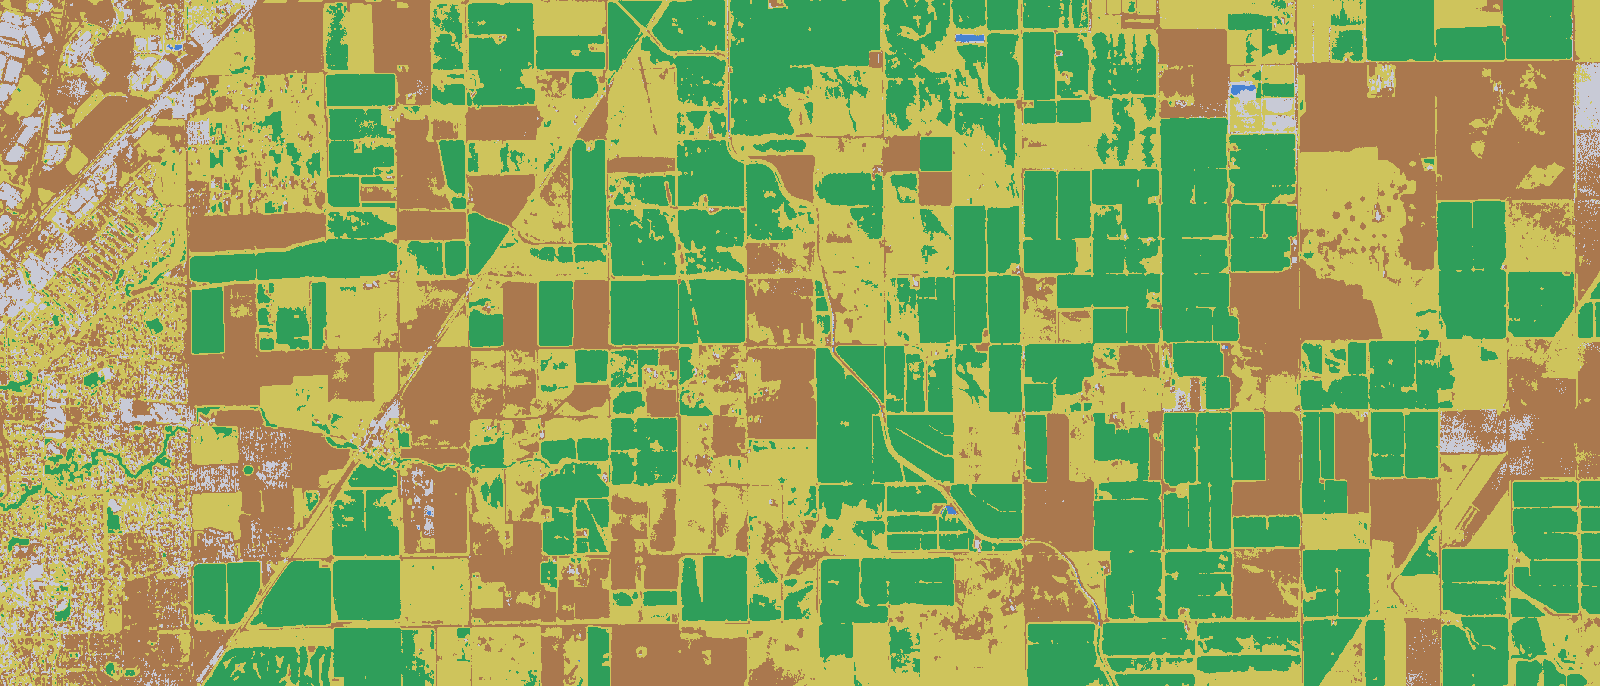
Threshold classification on a single 5.2 m scene; production maps add training data, several dates and field validation.
Outputs
- 01
Crop type maps
Parcels classified by crop from the season’s time series.
- 02
Growth curves
Index per parcel, date by date, against previous seasons.
- 03
Stress alerts
Parcels falling behind their neighbours or their own history.
- 04
Management zones
Within-field zones for variable-rate fertilising and seeding.
- 05
Irrigation
Water demand and stress from surface temperature and moisture.
- 06
CAP checks
Declared crop against observed crop; ploughing, mowing and harvest dates.
- 07
Damage assessment
Hail, flood, frost and fire damage mapped per parcel.
Season
- Sowing, planting
- Growth
- Harvest
Typical months in Greece. Imagery every few days through the growth window.